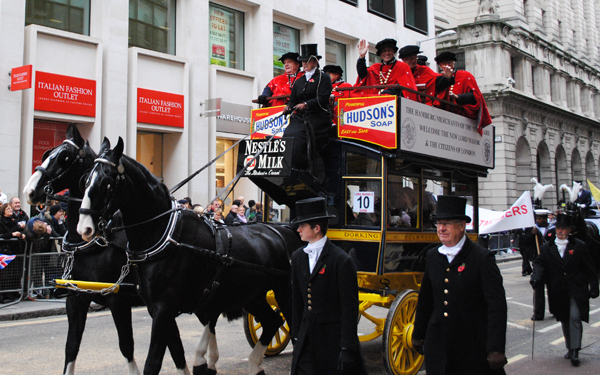
“Handelskammer Hamburg” is the Chamber of Commerce for Hamburg – https://www.hk24.de/. Unlike British or American chambers, German Handelskammers have statutory powers and levy charges on businesses. Their compulsory status also encourages leading businesspeople to participate more earnestly in commerce and trade policy issues. Starting with an initiative by Lord Mayor Michael Savory and Kenneth Stern, and picked up by Aldermen Alison Gowman, and Jeffrey Evans, they provide a float in the Lord Mayors’ Show every other year. Equally, each year two Aldermen go to Hamburg representing the City at the Handelskammer’s big annual celebration in October, the Morgensprache. 2015 would have been an ‘away’ year for the Hamburgers, but in honour of Lord Mountevans’ Mayoralty they made a special trip this year to be in the show.
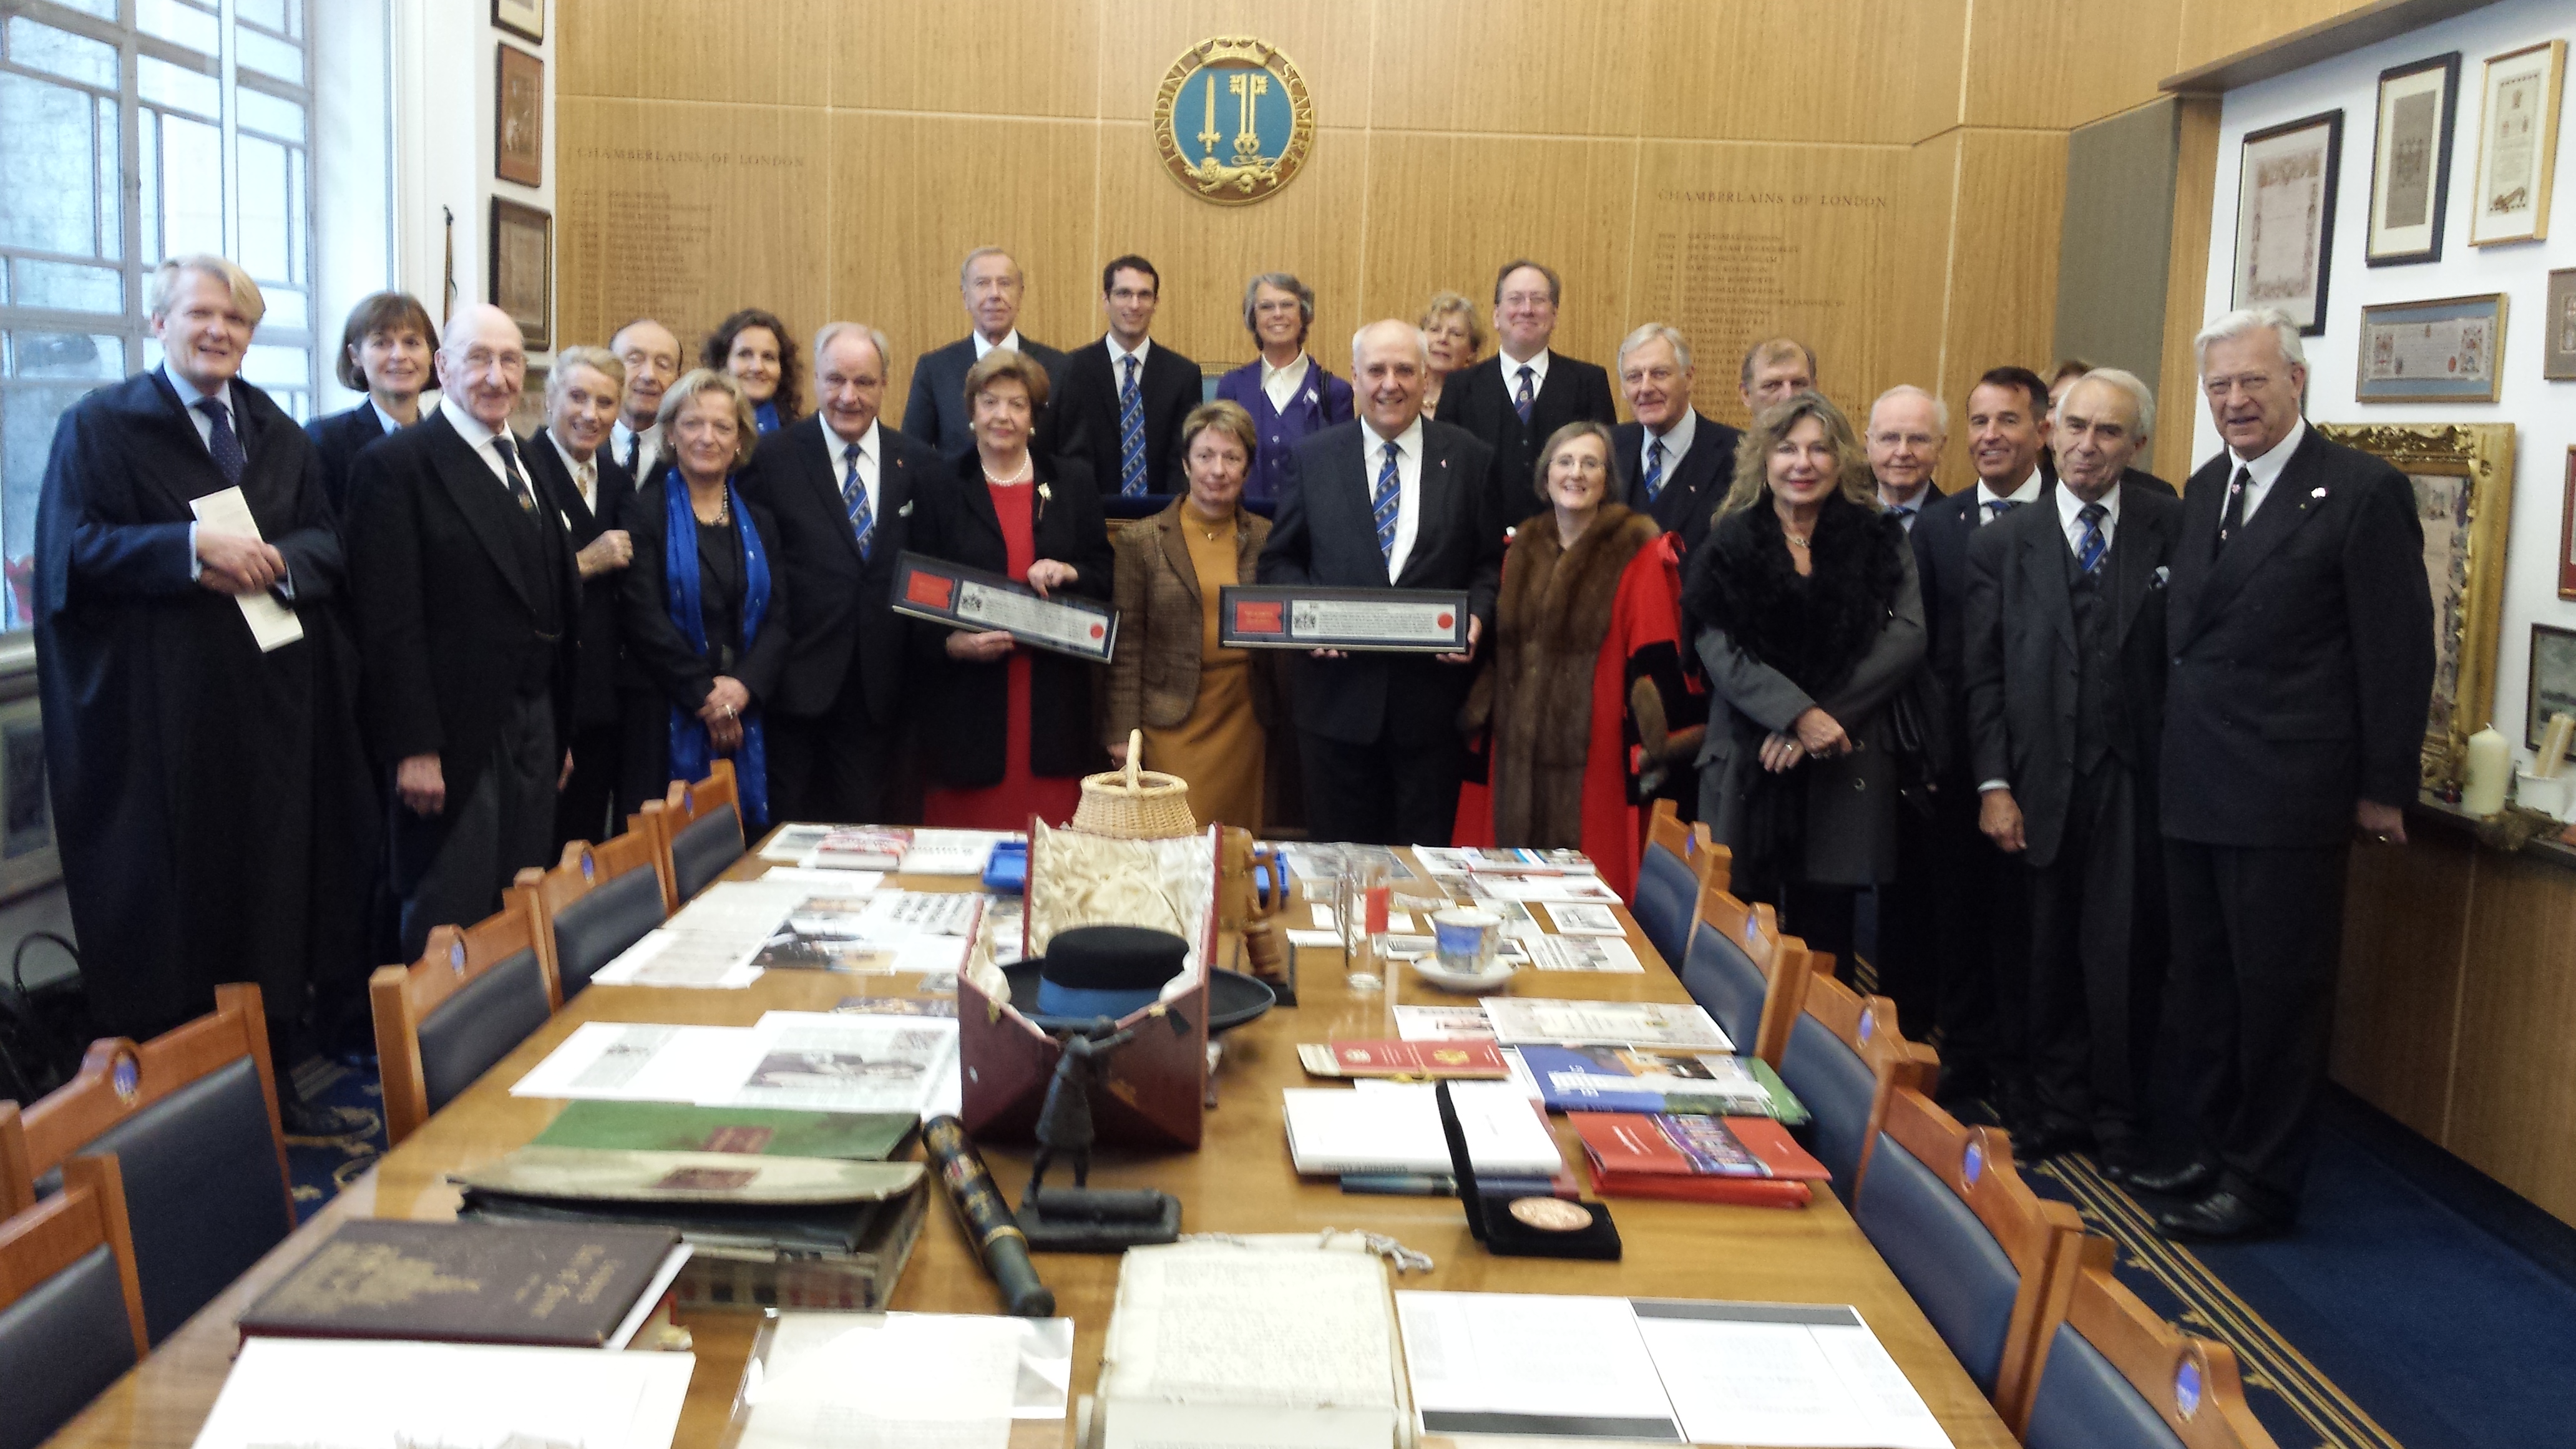
One of the most delightful trips we’ve made recently was when Elisabeth and I had a quasi-diplomatic mission to Hamburg, accompanying Alderman Alison Gowman and Murray Craig, Clerk of the Chamberlain’s Court, City of London, where we too became part of this initiative. The purpose of the mission was to deepen links with Hamburg for the benefit of both, a celebration of trade.
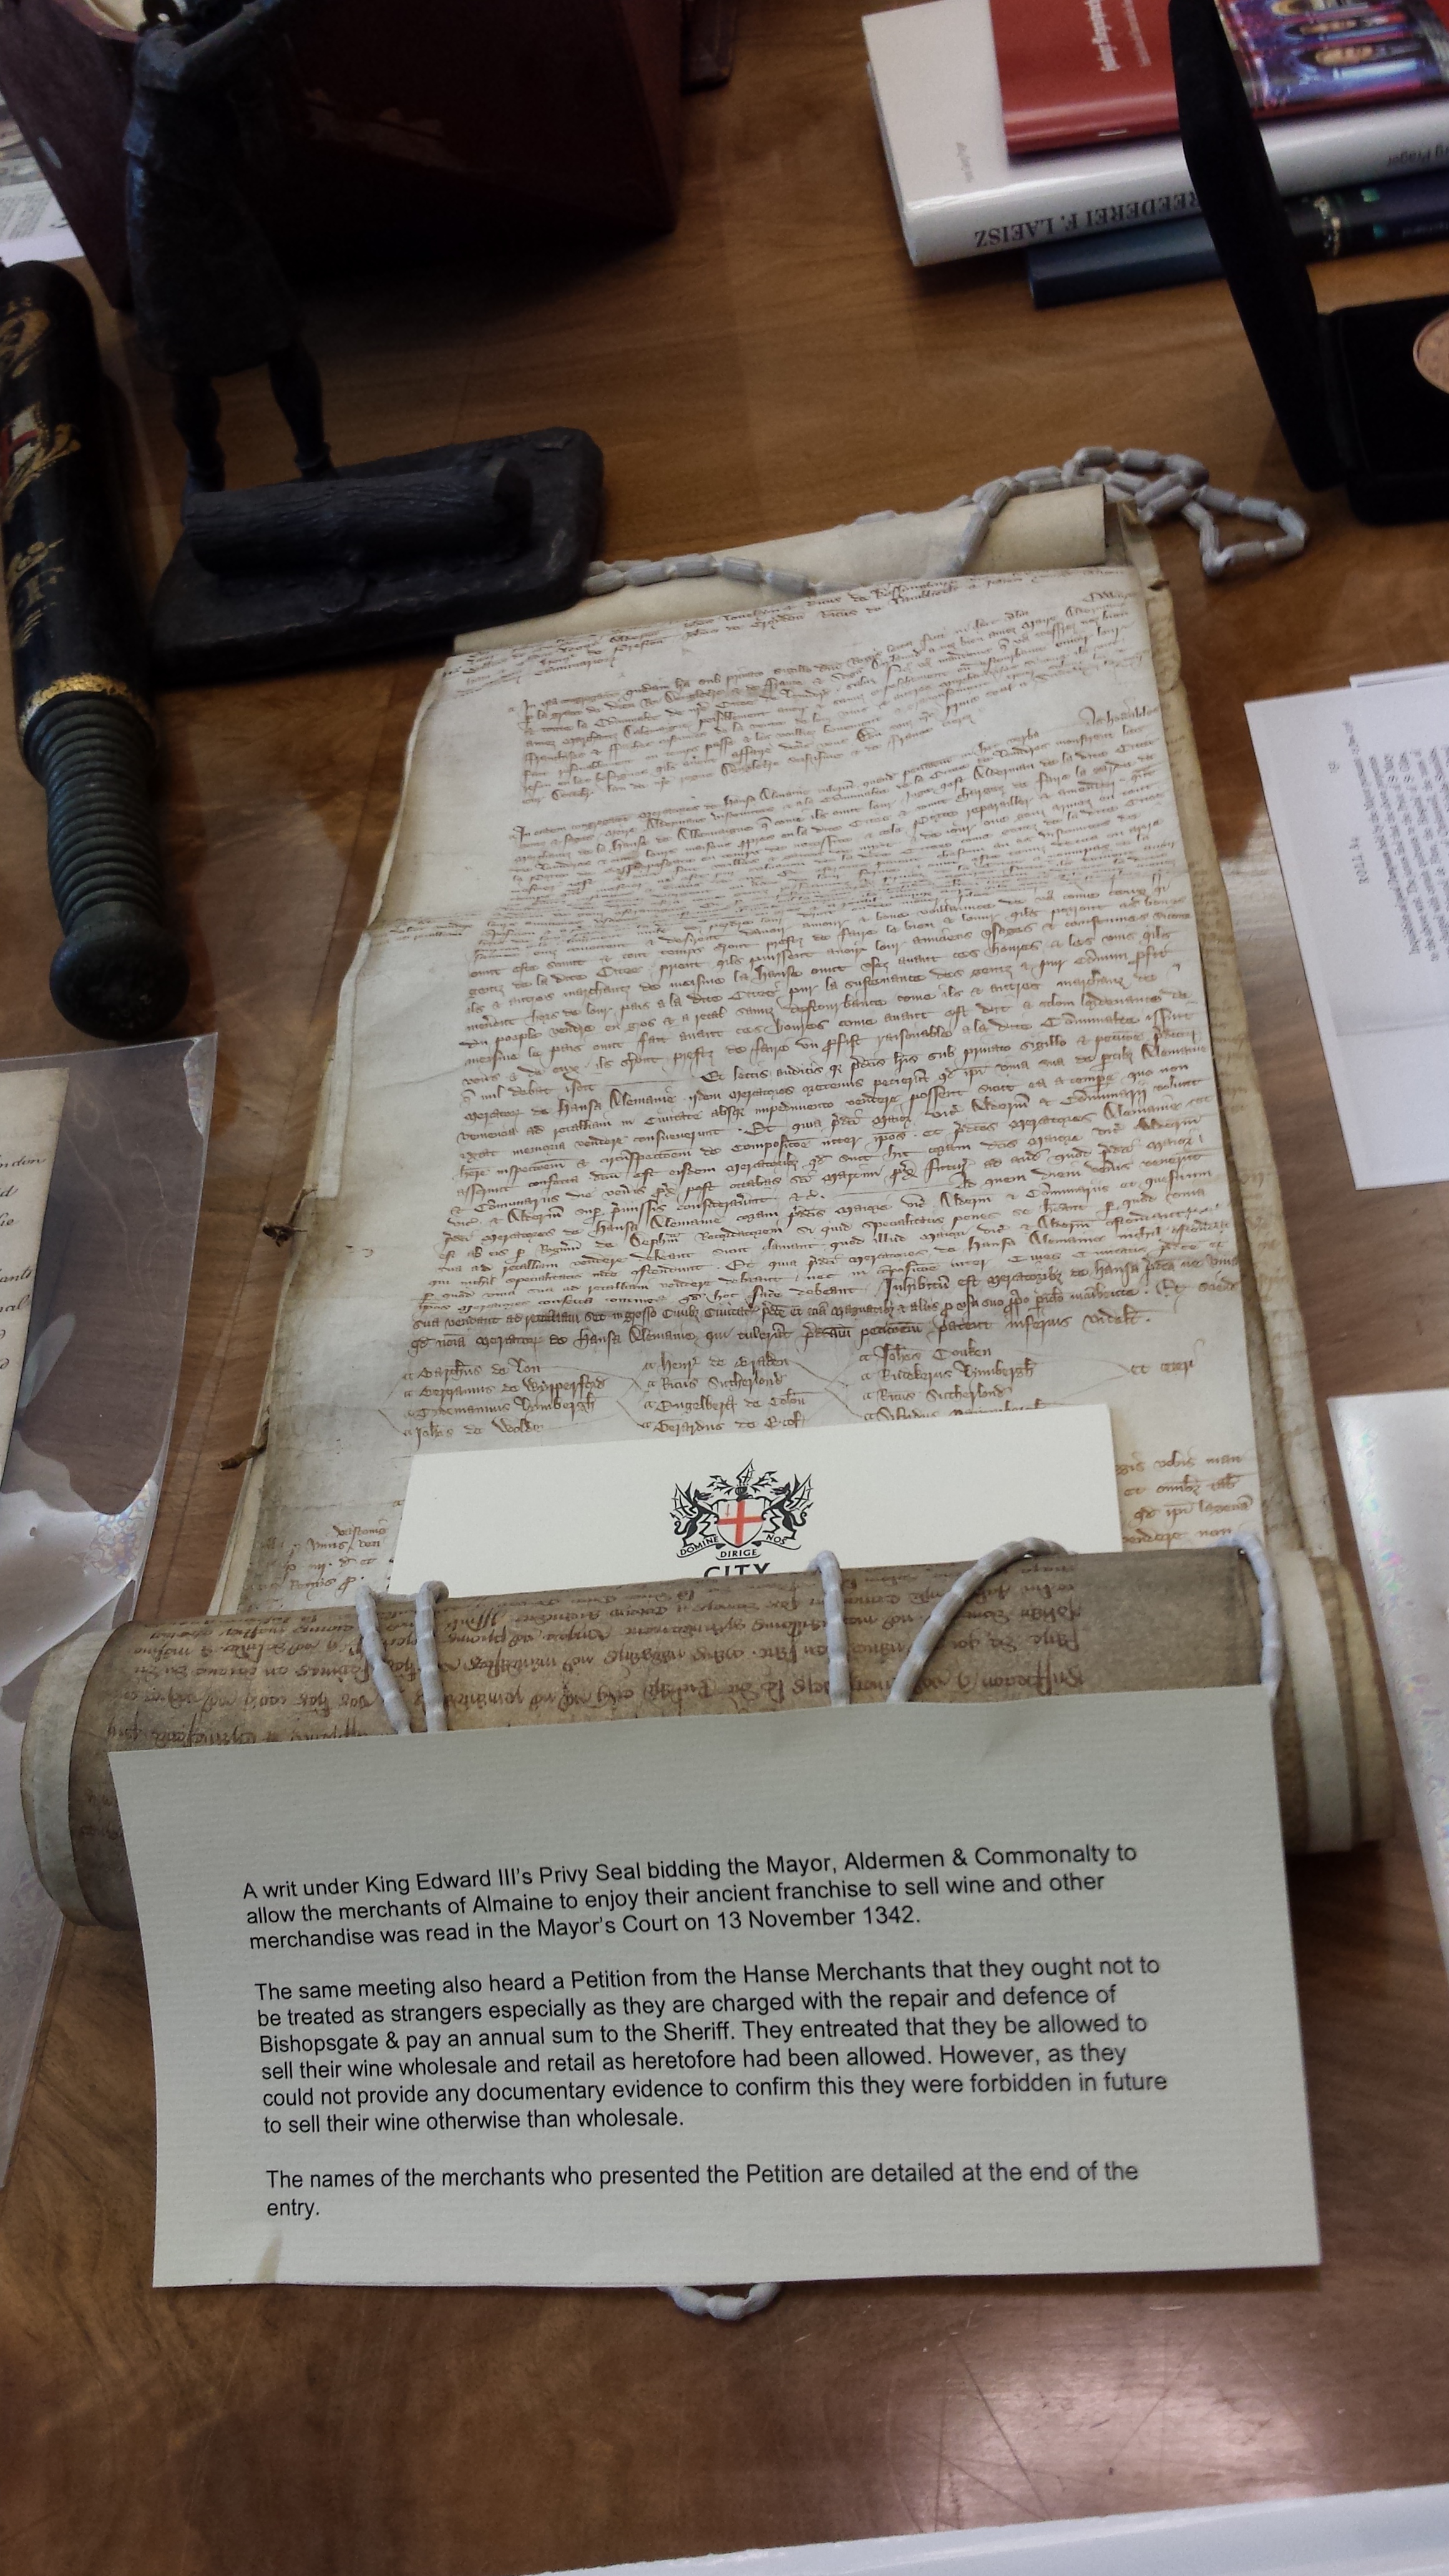
The Hanseatic links between London and various North Sea and Baltic ports are crucial in understanding history and where we are today, yet they get mistier. Few remember that the Hanseatic League maintained a Kontor (a medieval free trade zone) called the ‘Stalhof’ or ‘Steelyard‘ in the heart of London from 1266 till the merchants were thrown out in 1598 by Queen Elizabeth I. Though they returned, the Hanseatic League had certainly ceased trading by 1758. That said, Lübeck, Bremen and Hamburg only sold their common property, the London Steelyard, to the South Eastern Railway in 1852. Cannon Street station was built on the site and opened in 1866.
This link to the Hanse event and transcripts might interest – http://www.gresham.ac.uk/london-forgotten-hanseatic-city. My particular interest is here – http://www.gresham.ac.uk/sites/default/files/14jun07michaelmainelli_hanseanditsinfluence.doc
Our hosts were Handelskammer Hamburg (Hamburg Chamber of Commerce). Hamburg welcomed us most warmly. We learned a lot as well, particularly about the role of compulsory Chambers of Commerce and how that probably makes German apprenticeships far more successful than the British sort. They are full of pride about their City and their achievements, reminding me of a wonderful quote – “Bürgermeister Johann Heinrich Burchard (1852-1912) bemerkte zu der Nachricht, seine Majestät geruhe, Rudolph Schröder (1852–1938) in den Adelsstand zu erheben, Majestät könne ihn zwar in den Adelsstand ‘versetzen’, in ihn ‘erheben’ könne sie einen hanseatischen Kaufmann jedoch nicht.”
“Mayor Johann Heinrich Burchard (1852-1912) reacted to the news that it would please his Majesty to deign to raise Rudolph Schroeder (1852-1938) to the nobility by noting that his Majesty could indeed ‘place’ him in the peerage , however as a Hanseatic merchant he could never be ‘elevated’.”
[Renate Hauschild-Thiessen: “Adel und Bürgertum in Hamburg. In: Hamburgisches Geschlechterbuch”. 14, 1997, S. 21–32.]
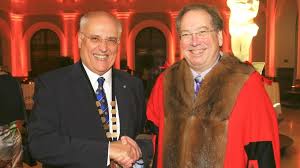
Our visit was well-covered and it is difficult to think of a more generous group of hosts than the ones we had. We toasted each other merrily with their traditional “Käse und Brot” “cheese and bread” (interestingly, in English we would say the reverse, “bread and cheese”), an ancient London shibboleth for the German-speaking community during the days of the Kontor in London at the Stalhof. THE HANSEATIC STEELYARD IN DOWGATE, by Alderman Alison Gowman in Mansion House on18 October 2013.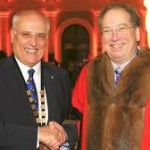
Perhaps not a speech full of content, but certainly full of warm feelings, I reproduce the text of my speech followed by an English translation:
Morgensprache – Deutsche
15 October 2015, Handelskammer Hamburg
Ältermann, sehr geehrte Damen und Herren, liebe Kolleginnen und Kollegen aus London,
Ich darf Sie herzlich von Alan Yarrow, The Rt Hon Lord Mayor of London, und seinen Sheriffs sowie dem Rat der Aldermen und Councilmen grüssen. Wir möchten von London nach Hamburg dem anhaltenden Erfolg Ihrer Morgensprache gratulieren.
Als Professor für Handel liebe ich eine Stadt, die den Handel feiert. Unsere beiden Städte sind sehr unabhängig. Die Freie und Hansestadt Hamburg ist ein stolzer Stadtstaat seit dem 9. Jahrhundert. Die City of London ist die älteste kontinuierliche Demokratie in der Welt. Unsere beiden Städte sind im Handel über die Jahrhunderte verbunden. Am 8. November 1266 wurde ein Vertrag zwischen Hamburger Kaufleuten und Henry III von England geschlossen um eine Hanse in London zu etablieren – das erste Mal in der Geschichte wurde dieser Begriff für die Liga eingesetzt.
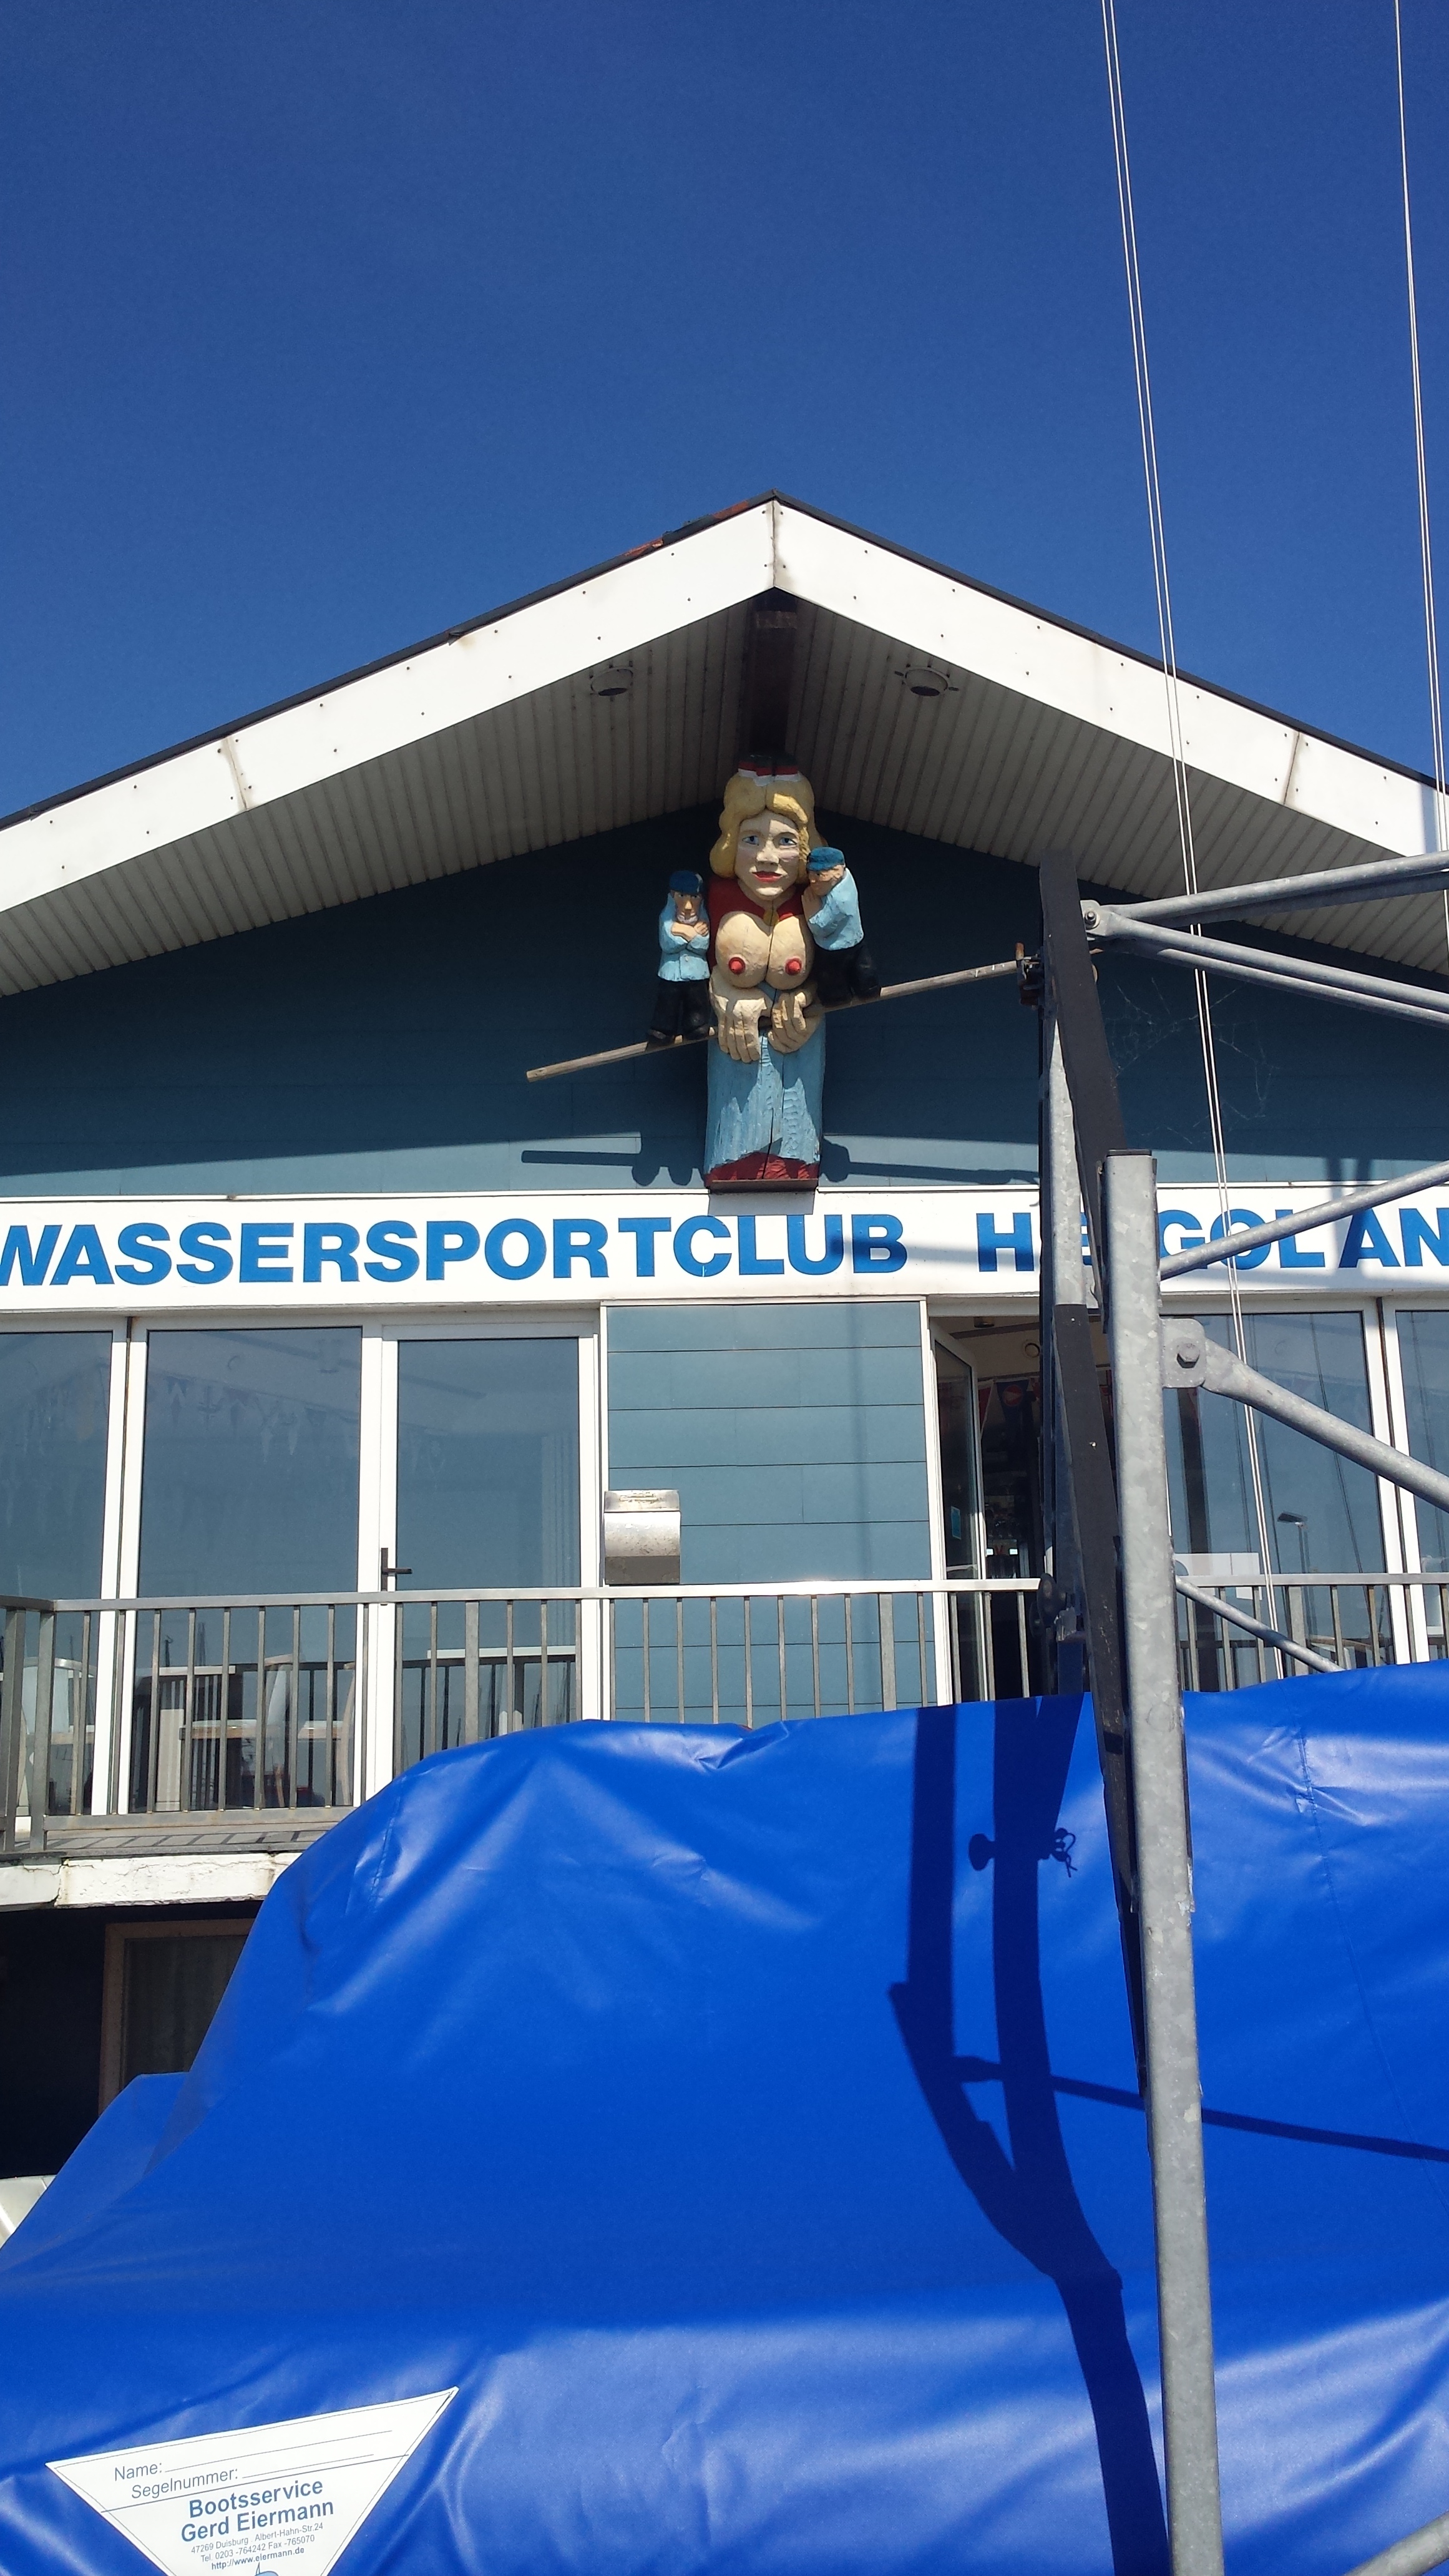
Unsere deutschen Verbindungen sind stark. Meine Frau kommt aus Franken. Meine Großmutter war Deutsche. Aber ich habe nie eine formelle Rede in Deutsch gegeben, so dass ich fast, wie in Franken, mit ‘Grüß Gott’ begann. Wir besuchen oft Freunde in Ihrer altehrwürdigen und lebendigen Stadt. Ich nahm jedes Jahr während den 2000er Jahren an der Kieler Woche teil. Meine Frau und ich sind in der Schifffahrt mit einem kommerziellen, und auch altehrwürdigen, Segelboot tätig und gehören der Gilde der Worshipful Company of Watermen & Lightermen an. Aber wir haben nie mit dieser Ehre gerechnet, heute zu Ihnen sprechen zu dürfen. Vielen Dank.
Unsere beiden Städte haben viel gemein – Schifffahrt, Technologie, Finanzen, Kunst, Medien und Verlagswesen – aber das Wichtigste, was unsere Städte vereint, ist die ähnliche Denkweise.
Eines Tages fragte eine Lehrerin, Frau Müller, ihren Schüler Johnny, „Johnny, wenn zwei Vögel auf einer Leitung sitzen, und ich feuere zwei Schüsse aus einer Schrotflinte, wie viele Vögel werde ich treffen?“ „Einen, Frau Müller.“ „Johnny, hör mir genau zu, wenn zwei Vögel auf einer Leitung sitzen, und ich feuere zwei Schüsse aus einer Schrotflinte, wie viele Vögel werde ich treffen?“ „Einen, Frau Müller“. „Warum, Johnny?“ „Frau Müller, nach dem ersten Schuss fliegt der zweite Vogel weg.“ „Johnny, das ist die falsche Antwort, aber mir gefällt, wie du denkst.“
Am nächsten Tag kommt Johnny ins Klassenzimmer. „Frau Müller, mein Vater sagt, daß ich mein Taschengeld sparen soll. Ich habe eine Wahl: Eine Bank bietet mir eine pädagogische Broschüre. Die andere Bank hat eine sehr hübsche Kassiererin. Welche Bank soll mein Konto bekommen?“ Die Lehrerin lacht, und sagt: „Nun, vielleicht diejenige mit der sehr hübschen Kassiererin. Johnny erwidert: „Nein Frau Müller, die mit der größten Staatsgarantie, aber mir gefällt wie Sie denken!“
Freiheit und Handel sind eng verwandt. Ohne Freiheit gibt es keinen fairen Handel. Die Sicherheit, dass uns der Handel liefert, was wir zum Leben brauchen, gibt uns das Vertrauen in die Zukunft, ohne dass wir von der Angst um das Überleben gelähmt sind. Die Freiheit, im Handel zu konkurrieren hält uns innovativ und relevant. Wie Friedrich Hayek schon fest stellte, die Freiheit ist nicht das Gegenteil von Zwang, sondern Freiheit ist Ordnung durch das Gesetz. Wir sind heute hier, um unsere gemeinsamen Hanse Traditionen zu feiern – Verbindung von Freiheit und Handel.
Das Wesen der Freiheit und des Handels verändert sich rasant. Wer hätte vor zwei Jahrzehnten gedacht, dass wir die Inhalte unserer Dachböden und Keller bei eBay handeln? Wer hätte die Explosion der billigen Flüge voraussehen können? Und es werden noch viel mehr Veränderungen kommen – der anhaltende Aufstieg Asiens von Japan über Korea, nach China und jetzt in Indien, die Öffnung des Iran, die Europäische Flüchtlingskrise, der Klimawandel, und wir blicken im Jahr 2050 auf Handel zwischen 10 Milliarden Menschen und Billionen von automatisierten Maschinen.
Während all dieser Veränderungen müssen unsere beiden Städte gemeinsam die Bedeutung der Freiheit und des Handels fördern. Wir haben eine moralische Verpflichtung, freie und wettbewerbsorientierte Märkte zu verteidigen. Die Gesellschaft hat viele Möglichkeiten zur Lösung von Krisen. Viele dieser Lösungen sind weder hübsch noch progressiv, sondern der Weg zur Leibeigenschaft. Der positive und direkte Weg, um Menschen in die globale Gemeinschaft zu bringen ist es, sie in die Welthandelsgemeinschaft einzubinden. Guter Handel macht gute Kameraden. Unsere Feier heute Abend ist ein freudiger Anlass, der als Erinnerung daran dienen soll, dass die Freiheit des Handels unsere Städte lebenswert macht.
Ich möchte mit einem Zitat aus der Antrittsrede von US-Präsident Thomas Jefferson schliessen – „Handel und ehrliche Freundschaft für alle”. Das Zitat ist das Motto meiner Gilde, der Worshipful Company of World Traders. Dieses Zitat verbindet unsere beiden Städte London und Hamburg. Darf ich Sie bitten, auf zu stehen, und einen Toast mit mir auf die Gesundheit der Freien und Hansestadt Hamburg zu trinken, „Handel und ehrliche Freundschaft für alle.”
“Freiheit des Geistes, der Chancen und des Handels”.
Morgensprache – English
15 October 2015, Handelskammer Hamburg
We from London wish to congratulate Hamburg on the continuing success of your Morgensprache celebrations. As a Professor of Commerce, I love a city that celebrates trade. Our two cities are fiercely independent. The Free and Hanseatic City of Hamburg has been a proud city-state since the 9th century. The City of London is the oldest continuous democracy in the world. Our two cities are united in trade over the centuries. On 8 November 1266 a contract between Hamburg’s traders and Henry III of England establish a hanse in London – the first time in history the term was used for the League.
Our German connections are strong. My wife comes from Franken. My grandmother was German. But I’ve never given a formal speech, so I almost began, as they do in Franken, with ‘Gruss Gott’. We visit friends often in your ancient and vibrant city. I raced sailboats at Kieler Woche every year during the 2000s. My wife and I are in shipping with a commercial sailing boat and belong to the Worshipful Company of Watermen & Lightermen. But we never expected the honour of being asked to address you today. Thank you.
Our two cities are united in so much commerce – shipping, technology, finance, arts, media and publishing – but the most important thing that unites our cities is similar ways of thinking.
One day a teacher asks her student Johnny, ‘Johnny, if there are two birds on a wire and I fire two barrels from a shotgun, how many birds will I hit?’. ‘One, Miss’. ‘Johnny, please listen, if there are two birds on a wire and I fire two barrels from a shotgun, how many birds will I hit?’. ‘One, Miss’. ‘Why Johnny?’. ‘Well Miss, after you fire the first barrel the second bird will fly away.’ ‘Johnny, that’s the wrong answer, but I like the way you think.’
The next day Johnny comes into the classroom. ‘Miss, my Dad says that I must save my allowance. One bank offers me an educational booklet. The other bank has a very pretty teller. Which bank should get my account?’ The teacher blushes, and says ‘Well, perhaps the one with the very pretty teller.’ Johnny replies, ‘No Miss, the one with the biggest government guarantee, but I like the way you think!’.
Freedom and trade are strongly related. Without freedom there is no fair trade. The certainty and confidence that trade can deliver what we need to live gives us the confidence to think to the future, not paralysed by fear of surviving the present. The freedom to compete in trade keeps us innovative and relevant. Yet Friedrich Hayek notes that freedom is not the opposite of constraint, rather, “freedom is order through law”. We are here today to celebrate our mutual Hanseatic connections – bindings of freedom and trade.
The nature of freedom and trade is changing rapidly. Who would have thought two decades ago that we would be trading the contents of our attics and basements on eBay? Who could have foreseen the explosion of cheap air flights? And there is much more change to come – the continuing rise of Asia moving from Japan to Korea to China and now to India, the opening of Iran, the European refugee crisis, climate change, looking to commerce and trade in 2050 among 10 billion people trading with trillions of automated machines.
Throughout all of these changes, our two cities must mutually promote the importance of freedom and trade. We have a moral obligation to defend free and competitive markets. Society has many ways of resolving crises. Many of society’s ways of dealing with problems are neither pretty nor progressive, the roads to serfdom. The most positive and direct way to bring people into the global community is to bind people into the global trading community. Good trade makes good fellows. Our celebration tonight is clearly fun, but hopefully it provides a small reminder that freedom to trade makes our cities worth living in.
I would end with a quote from US President Thomas Jefferson’s inaugural speech of 1801 – “with commerce and honest friendship for all”. The quote is the motto of my Worshipful Company of World Traders. This quote unites our two cities of London and Hamburg. May I ask all of you to be upstanding and drink a toast with me to the health of the Free and Hanseatic City of Hamburg, “with commerce and honest friendship for all.”